
New approach in panel data analysis
LI Jialiang (Group Leader, Statistics and Applied Probability) () July 27, 201627 Jul 2016. NUS statisticians have developed a model which accounts for hidden factors and their effects for improved accuracy from economic data.
Panel data are a type of longitudinal data, or data collected at different points in time. These could include stock prices over several weeks or household expenditure data over several quarters. These data can provide information predicting the dynamics in economic behaviour to changes in social phenomena over a period of time.
A team led by Prof LI Jialiang from the Department of Statistics and Applied Probability at NUS together with Dr KE Yuan from Princeton University and Prof ZHANG Wenyang from University of York have developed a model that provides more accurate results from panel datasets. Their method uses a data-driven approach to identify and account for the groups within the panel data that have interactive effects and their impact on the dataset. Such effects are not taken into account in existing approaches.
The research team conducted simulation studies to compare the new method with existing approaches. The results supported the new method. They also applied their model to analyse a dataset on income dynamics using data from the Panel Study of Income dynamics (PSID) from 1976 to 1982. The PSID is a household survey with a nationally representative sample of over 18,000 individuals living in 5,000 families in the United States. In their model, the income differences between individuals were predicted from their own characteristics and the effects pertaining to each particular year. This is in contrast with the standard model (linear mixed effects model), whereby only subject-specific random effects are modelled and these random effects are assumed to be the same across different years. The outcomes from their model were found to be a closer match to actual sampled data.
The research team is developing the necessary theoretical and computational framework to tackle more complex issues requiring advanced requirements. These could include models with correlated factors for situations with multiple levels of unobserved hidden factors or if random factors progress dependently over a period of time.
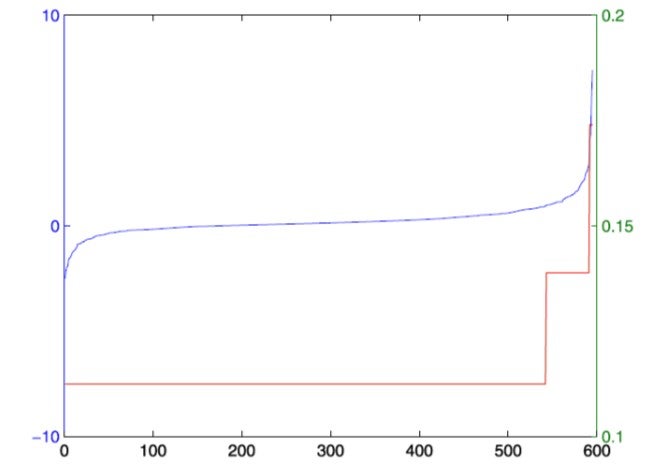
Figure shows the estimated coefficients for “full time work experience” for all individuals in the PSID data. The blue line is the sorted heterogeneous estimate for individual subjects before grouping. The red line is the sorted estimate after grouping, showing three homogeneous sub-populations.
Reference
Ke Y., Li J., Zhang W. “Structure Identification in Panel Data Analysis”. The Annals of Statistics volume 44, number 3 (2016), 1193-1233.