
Professor CHEN Ying’s team from the Department of Statistics in NUS has been developing new statistical approaches and methodologies to deal with big data. The team conceptualizes Big Data as curves, surfaces and other more complex geometric objects that evolve over a period of time. They found that big data can be estimated, modeled and forecasted with much improved efficiency and accuracy. They have applied the method to successfully forecast the daily electricity price curves in California (see Figure 1). The new method is able to reduce forecast errors by 15%, which is better than several other popular models. The team is also presently applying their methods to analyze functional magnetic resonance imaging (fMRI) data (see Figure 2).
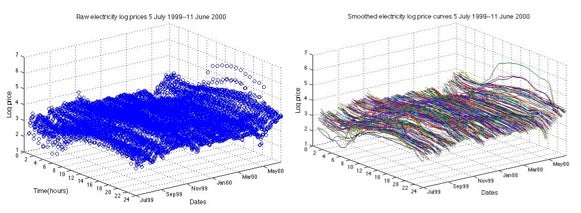
Figure 1. Application of Big Data analysis to California electricity market prices. Left: Log-prices 24 hours a day, 7 days a week from 5 July 1999 to 11 June 2000. Right: Smoothed log-price curves of the California electricity market. (Image credit: CHEN Ying)
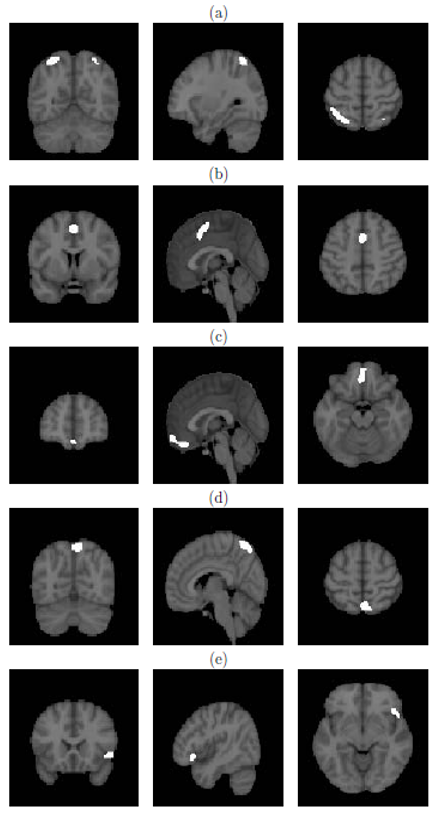
Figure 2: Application of Big Data analysis to fMRI images: (a) Estimated function with largest values in Parietal Cortex; (b) with largest values in ventrolateral prefrontal cortex (VLPFC); (c) with largest values in middle orbito-frontal cortex (mOFC) and inferior orbito-frontal cortex (lOFC); (d) with largest values in Parietal Cortex; (e) with largest values in anterior insula (aINS). (Data source: fMRI data from CRC649, RPID tasks, 17 subjects, healthy young Germen, right-handed, 91X109X91 voxels, 27X3 trails and 1360 scans (2.5 seconds per scan), sfb649.wiwi.hu-berlin.de)