Statistical models for classifying acute leukemia
Ajay JASRA (Group Leader, Statistics and Applied Probability) () October 28, 201428 Oct 2014. NUS researchers developed a new Bayesian statistical model that can be used for classifying acute leukemia.
A team led by Prof Ajay JASRA from the Department of Statistics and Applied Probability in NUS has developed a new statistical model and computational methodology to identify the salient parameters (which are a priori unknown) out of a larger set of available parameters for data classification and for performing predictions. The new model selects the parameters, which are relevant to the particular classification problem, and is able to classify data from a given group; there are very few statistical models in the literature that can do this. In particular, the model is applied in the context of classifying acute Leukemia.
The application to Leukemia was performed on a data set from Golub et al. (1999). One of the challenges of cancer treatment is identifying patients’ specific tumor types, which is important because the tumor type often determines the most effective clinical course. The article investigates acute lymphoblastic leukemia (ALL) or acute myeloid leukemia (AML), depending on whether the cancer arises from lymphoid precursor cells or myeloid precursor cells, and characterizes the acute Leukemia type on the basis of particular gene expression levels (for details see Golub et al.). The article demonstrates the developed methodology correctly identifies the important genes that can be used for cancer type prediction and then correctly identifies the cancer.


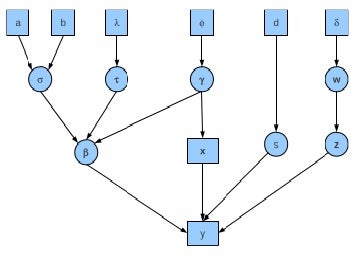
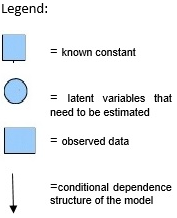
Directed Acyclic Graph (DAG) showing the hierarchical structure of the priors on the parameters of the proposed mixture model. This represents the probabilistic structure of the statistical model. From a statistical perspective, the model is associated to observed response variable y and explanatory variables x, of which there are many. The model has k possible different explanations of y through x, with model parameter and included variables . The probability that a particular response and explanatory variables are from one of the k models is through a vector w, with the model type z. The other variables are of a technical nature and the definitions can be found in Cozzini et al (2014). [Image credit: Cozzini A, Jasra A, Montana G, Persing A]
References
1. Cozzini A, Jasra A, Montana G, Persing A. “A Bayesian mixture of lasso regressions with t-errors.” Computational Statistics and Data Analysis. 77 (2014) 84.
2. Golub TR, Slonim DK, Tomayo P, Huard C, Gaasenbeek M, Mesirov JP, Coller H, Loh M, Downing J, Caligiuri M, Bloomfield C, Lander E. “Molecular classification of cancer: class discovery and class prediction by gene expression monitoring.” Science 286 (1999) 531.


